Potential Induced Degradation (PID)
Published:
The Potential Induced Degradation (PID) typically appears after the installation is commissioned and can reduce the performance of a PV string up to 20-80%, according to Libby et al. [1].

This blog post investigates the topic of Potential Induced Degradation (PID) in photovoltaic modules. It starts by giving an overview. In a second section, it delves into the PID shunting mechanisms. Then, it includes some information on the electrical signature of PV modules affected by PID, detection methods, repair techniques and prevention actions against PID.
I. Overview
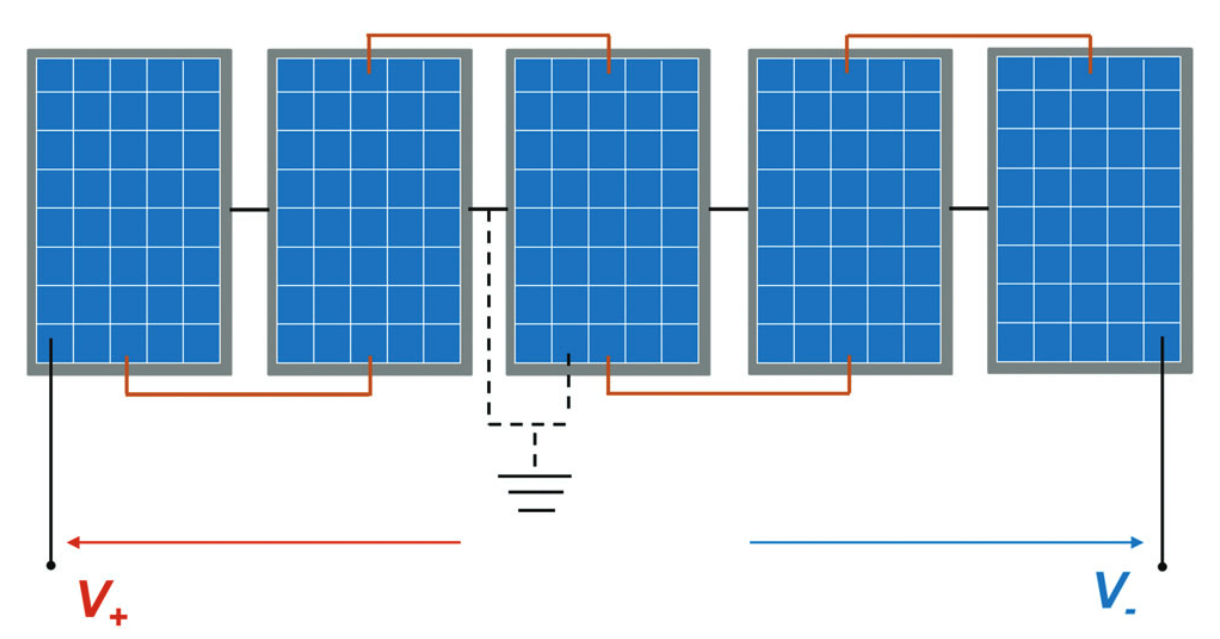
As illustrated in Figure 1, the potential difference between PV modules and the ground increases with the number of modules in series. Then, PID, or Potential Induced Degradation, occurs when the PV system experiences significant voltage differences between the cell and the frame and leads to leakage currents.

As example, a study mentioned by Libby et al. [1] reported an average performance loss of 41% on a 10.7 MW power plant in Spain.
PID has many different forms and differ as function of the PV sandwich materials. The main PID mechanisms are summarized in the Table below.
| Mechanism | Description | Reversible? |
|---|---|---|
| 1. PID-p polarization | Accumulation of charge density on the surface of the silicon | Yes |
| 2. PID-s shunting | Current leakage | Yes |
| 3. Electrochemical Reaction | Corrosion due to moisture infiltration | No |
II. PID-s shunting
One of the most known PID degradation mechanisms is called PID shunting (PID-s) and appears when some significant electric potential difference causes leakage currents to flow from the module frame to the solar cells [2]. Factors contributing to the PID in photovoltaic (PV) modules include:
- System Characteristics: Significant potential difference (usually around one thousand volts) between the ground and the cell is the major cause of current leakage and the higher the voltage is, the more the PID degrades the module performances.
- Environmental Conditions: High humidity and elevated temperature enables better conductivity and facilitates current leakage. Also, positive charges coming from soiling [2] can accelerate the degradation process.
- Module Composition: Low resistivity of encapsulation material (EVA) and a presence of a frame helps the electron diffusion process out of the normal electrical circuit. Also, a “soda-lime glass” with sodium concentration in the front glass would accelerate the PID mechanisms.
- Cell Design: Standard Anti-Reflective Coating (ARC) layer including sodium ions also positively assist the process.
To explain PID in a nutshell, the potential difference between the cell and the frame at the ground causes 6 leakage current paths as illustrated in Figure 2. The most significant leakage currents pass through path 1.

Because of the leakage current through path 1, Na+ ions are formed in the glass plate and:
- Migrate through the glass layer (SiNx) towards the ARC layer.
- Accumulate in the thin ARC layer (SiOx).
- Infiltrate into defects of the P-N junction as “stacking faults”.
In the stacking faults, the initial Na+ ions are neutralized by free electrons and allow other Na+ ions to follow in the stacking fault and go further. This stacking fault further eases and accentuates the leakage currents towards the frame, creating some kind of “electron highway” to exit the normal circuit. This mechanism especially creates a negative feedback loop and is accelerated over time by itself.
III. Signatures
PID originates from a non-optimal system conception and appears just after the commissioning.
Some conditions enhance temporary the PID effect. At low irradiance, the loss of efficiency becomes more severe compared to STC conditions as the decrease in photocurrent makes leakage current losses predominant [2]. In the morning, significant losses may occur due to dew, which enhances the conductivity of the front glass. [2], [3].
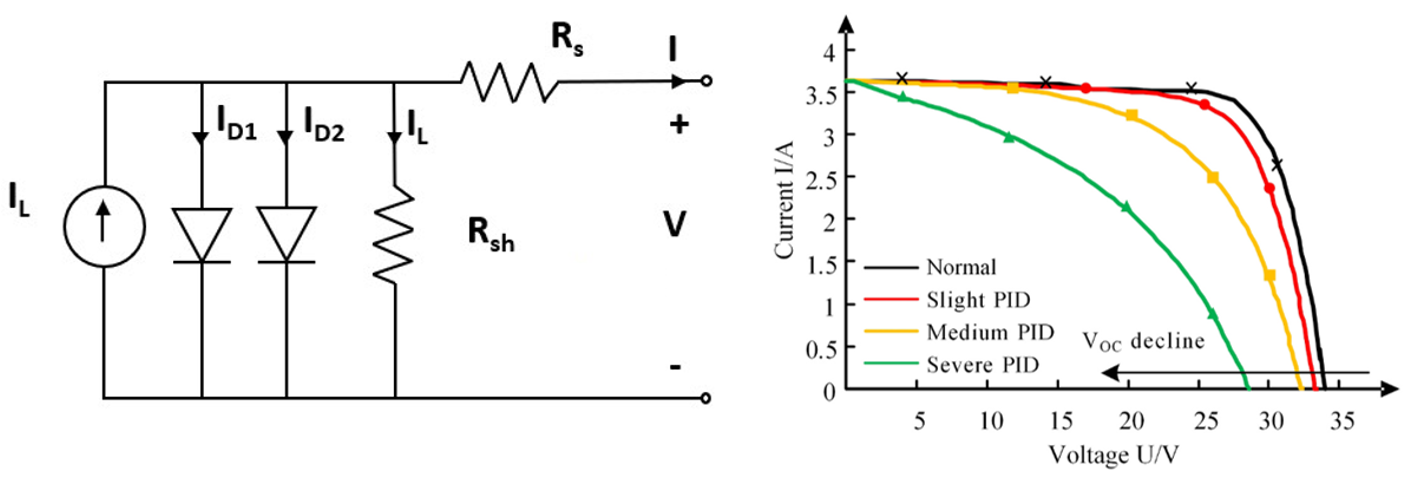
Mostly heterogeneous among the module population [4], the PID electrical signature is characterized by a decrease in the shunt resistance $R_{sh}$ and increase in junction recombination parameters $I_{D2}$ and $n_2$ of the second diode in the two-diode model as illustrated in Figure 3. The open-circuit voltage $V_{oc}$ decreases, the slope at the y-intercept increases and the operating point is modified with a lower extractable power $P_{mpp}$.

With regard to the evolution over time, c-Si PID (excluding the regeneration process) is directly proportional to the applied voltage and has been modeled as in the equation (1) according to Hacke et al.’s model [6]. This relationship specifically shows a exponentional degradation trend over time. $V$ is the voltage, $E_a$ the activation energy, $k_b$ the Boltzmann’s constant, $RH$ the relative humidity and $t$ is the time.
\[\frac{P_{m}(t)}{P_{nom}} = 1 - V \cdot A \cdot e^{\frac{E_a}{k_B \cdot T_{mod}}} \cdot RH^B \cdot t^2\]Note that those models assessing the degradation over time are usually validated in laboratory but not in outdoor conditions where PID is a continuous tradeoff between degradation and regeneration [3].
Furthermore, PID might also lead to some other negative consequences as shown in Figure 4.

VI. Detection
Visually detecting PID is challenging [7] and the failure recognition relies, then, on other detection methods such as electroluminescence, thermography, and I-V tracing. Electroluminescence is the most spread and accurate technic to identify PID. IV tracing or direct Voc measurement are less accurate, but it can be easily applied and quickly detect an anomaly from PID. Finally, infrared thermography will reveal the consequential hotspots.
The IEC 62804 [8] serves as a standard for evaluating the impact of potential-induced degradation (PID) on PV crystalline modules. This comprehensive test entails exposing the PV panel to conditions including a temperature of 60°C, 85% humidity, a voltage difference of 1000V, all over a duration of 96 hours. A module is deemed to have failed the test if power degradation is over 5%.
V. Repair
Except changing the configuration of the PV array to avoid high voltage, some regeneration techniques exist to temporary recover the PV panel characteristics [2].
On one hand, thermal regeneration consists of applying high temperature to the module while maintaining low humidity levels to regenerate the module material.
Electrical regeneration, on the other hand, applies reverse voltage to restore the natural composition of the materials. For instance, Kwembur et al. [9] illustrate a 94% regeneration after applying reverse voltage. However, electrical regeneration is never 100% complete due to the original induced corrosion + remaining Sodium (Na) in the “stacking” faults [2].
VI. Prevention
When addressing potential-induced degradation (PID), some specific actions can significantly mitigate its impact, ensuring sustained efficiency over time. The target of those actions can be broken down into 4 categories [7] as illustrated in Figure 5.

- Environment: Prioritizing regular cleaning to remove accumulated soiling minimizes PID risk because of positive charges from the dust.
- System: Implementing measures such as setting the frame to a negative potential and utilizing “PV offset boxes” that apply reverse voltage overnight offer effective PID prevention strategies. [1].
- Module: Enhancing the material encapsulation by considering alternatives like TPO [1], [2] or replacing the front glass with a lower ion concentration variant can avoid PID [2].
- Cell: Increasing the Si/N ratio to reduce the sodium ion concentrations in the ARC layer [1], [2] or introducing a SiO2 layer between the Si cell and the ARC layer have also been demonstrated to reduce PID [2].
In summary, this blog post investigates the Potential Induced Degradation (PID) in photovoltaic (PV) modules which can reach dramatic performance reductions. After covering its mechanisms, causes, electrical signatures and detection methods, some regeneration techniques and preventive actions are listed to avoid performance losses.
References
[1] C. Libby, ‘Literature Study and Risk Analysis for Potential Induced Degradation’, 3002003737, Dec. 2014.
[2] AE Solar Energy, ‘Understanding Potential Induced Degradation’. 2013.
[2] W. Luo et al., ‘Potential-induced degradation in photovoltaic modules: a critical review’, Energy Env. Sci, vol. 10, no. 1, pp. 43–68, 2017, doi: 10.1039/C6EE02271E.
[3] E. Annigoni et al., ‘Modeling Potential-Induced Degradation (PID) in crystalline silicon solar cells: from accelerated-aging laboratory testing to outdoor prediction’, Munich, Germany, Sep. 2016, pp. 1558–1563. doi: 10.4229/EUPVSEC20162016-5BO.11.2.
[4] M. Dhimish and A. M. Tyrrell, ‘Power loss and hotspot analysis for photovoltaic modules affected by potential induced degradation’, Npj Mater. Degrad., vol. 6, no. 1, p. 11, Feb. 2022, doi: 10.1038/s41529-022-00221-9.
[5] M. Ma, H. Wang, N. Xiang, P. Yun, and H. Wang, ‘Fault diagnosis of PID in crystalline silicon photovoltaic modules through I-V curve’, Microelectron. Reliab., vol. 126, p. 114236, 2021, doi: 10.1016/j.microrel.2021.114236.
[6] P. Hacke et al., ‘Accelerated Testing and Modeling of Potential-Induced Degradation as a Function of Temperature and Relative Humidity’, Jun. 2015, doi: 10.1109/PVSC.2015.7355627.
[7] M. Köntges et al., ‘Review of Failures of Photovoltaic Modules’, IEA PVPS T13, IEA-PVPS T13-01:2014, 2014.
[8] IEC, ‘IEC TS 62804-1-1:2020, Photovoltaic (PV) modules - Test methods for the detection of potential-induced degradation - Part 1-1: Crystalline silicon - Delamination’. Oct. 2020.
[9] I. M. Kwembur, J. L. Crozier McCLeland, F. J. Vorster, et E. E. vanDyk, «A case study on monitoring Potential Induced Degradation (PID) recovery in multi-crystalline modules», SAIP2019 Proceedings, S 263 A Institute of Physics, 2019.
[10] B. Weinreich, Field study module and generator quality based on thermography measurements of 100 MW, Proc. 28th Symposium Photovoltaische Solarenergie (OTTI, Bad Staffelstein, Germany, 2013), Regensburg 2013, ISBN 978-3-943891-09-6
