Cell cracks
Published:
Silicon within PV modules is brittle, and cell cracks are expected in the natural aging of PV modules. However, some severe cracks might lead to high mismatches, potentially activate bypass diodes, and significantly decrease power module performances.
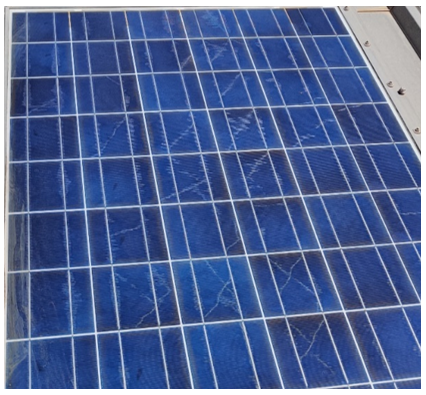
This blog post presents an overview of cell cracks with the different types, when those occur over time, the signatures, the concomittant failures and the associated detection methods.
I. Overview
PV cells are fragile and are highly subject to cracks with various sizes and orientations [1]. Six crack categories have been defined [2] and completed with a seventh from Morlier et al [3], the so-called cross crack, which is caused by needles pressing on the wafer during production [1], [2]. A repetitive crack pattern could be caused by a production failure, whereas PV modules showing dendritic crack patterns have been probably exposed to heavy mechanical loads.[4]

Those cracks usually originate and expand over time due to mechanical and thermal stresses. The root causes originate from different stages [1], [5]:
- Manufacturing: The wafer slicing, cell production, stringing and embedding processes initiate the formation of cracks [1].
- Transport: Poor packaging and vibration during transportation induce some initial cracks.
- Installation: Manipulation of the PV modules and eventually stepping,
- Operation: Additional mechanical loads from hail, wind, snow, or thermal expansion heterogeneities within the module help developing some cell cracks.
II. Apparition
Cell cracks appear inhomogeneously in PV systems [6]. According to Kontges et al., it is still unknown with which probability cell cracks occur in a given environment [7]. The crack evolution over time and climate influences on the crack development are still up to investigations [6].
Some work [1] suggests a probability of 5% to get a cracked cell from production and field data. As illustration, a distribution of cell cracks from a PV-system on the field which is particularly affected from cracks [3] is shown in Figure 3.
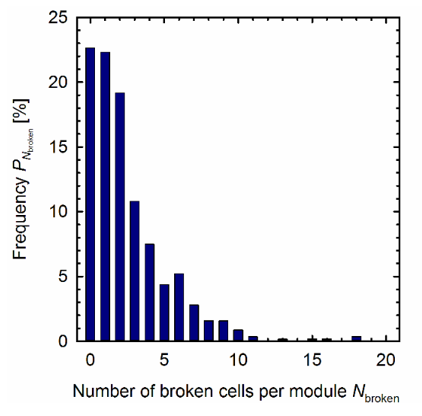
Cell cracks dominate early failures in years one and two after installation [6], [8], [9]. The reported PV modules from the field with cell cracks amount to around 2% for moderate climates [6], [10].
III. Signatures
The power loss induced from cell cracks is challenging to quantify and depends on the isolated area from the crack. Most of the cell cracks do not electrically isolate cell parts from the circuit [6] and will not significantly reduce the module power [6].
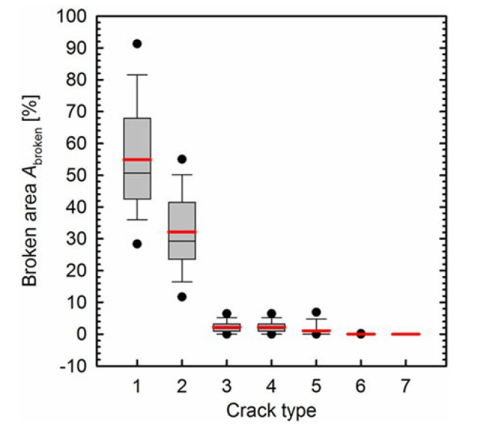
Overall, the cell crack effect is moderate with global degradation rate remaining at reasonable levels below 3% per year for all climate zones, except for cold and snowy zones, where the degradation rates of the affected part are highest with approximately 8% per year [6]. However, in some extreme case, if the crack isolates some substantial cell area, some more significant power losses occur as shown on Figure 4 as function of the cell crack types.
An inactive (or isolated) cell part means that this particular part of the photovoltaic cell no longer contributes to the total power output of the solar module [1]. Isc, is proportional to the total active cell area and if this area is reduced so the Isc goes under Impp, the voltage over the broken cell becomes reverse biased and induce some more significant losses. A defective cell stays in forward biais if the following equation is respected.
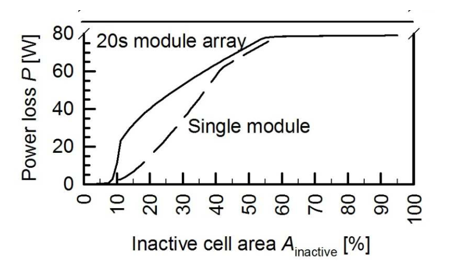
\[\frac{A_{inactive}}{A_{total}} < \frac{I_{sc}-I_{mpp}}{I_{sc}}\]When this inequality is not respected (with an inactive area more than 8% in general), it will lead to a power loss roughly linearly [1] as shown on Figure 5 (dotted line). Before that, no significant loss is observed. With a breakdown voltage greater than 15 V, in between approximately 12 and 50% of inactive cell area of a single cell in the PV module the power loss increases nearly linear from zero to the power of one double string for cells [11], [12]. Finally, an inactive area greater than 50% would lead to the activation of the bypass diode [1].
To illustrate this progressive loss, a cell crack has been simulated at 1000W/25°C and the effect on the whole module has been studied by assembling the IV-cell curves together at the module level assuming 3 substrings of 20 cells in serie connected with bypass diodes with an activation voltage of -0.5V. The cells are assumed to have a breakdown voltage of 15V. Four cases have been examined with one cell getting an inactive area of 5%, 15%, 30% and 45% reducing the current generation proportionally on Figure 6. At 5%, the inequality (1) is still respected, and the operating point does not change significantly: the power is reduced only by 0.2%. For 15% and 35% of inactive area, the operating current is constrained by the cracked cell maximum current and the maximum power decreases by 5% and 19% respectively. Then, from 45% of inactive area, the bypass diode of the cracked substring gets activated, and the power is reduced by 35%.


In the case, of a higher breakdown voltage (-10V), the power loss follows the same trend until a certain point where the cell is reverse-biaised without activating the bypass diode at the substring level as in Figure 7. In that case, the cell “consumes” power and dissipates it which creates hotspots and this might be highly detrimental in the long term with higher degradation rates than expected.


A reduction in current is the major contribution to the loss of power [6], [8] due to a reduction in current that is not generated from isolated parts. However, cracks on the electrical circuit would also increase the resistance in series. This increase in resistance typically accounts for less than one third of the power loss [6].
Cells cracks also increase the recombination current in the cell junction [6], [13]. The losses take higher proportions at lower irradiances but overall, this effect remains under 2.5% of losses [11].
IV. Concomitant failures
Small cell cracks (micro-cracks) become visible by eye when they form snail tracks or when photobleaching as in Figure 8. Photobleaching is a counteracting effect to the yellowing of the encapsulant and it occurs along the cracks and the borders of the cells [4]. Cell cracks may be followed by the appearance of snail tracks, which are the result of the discoloration of the metallization of the silver electrodes and the discoloration of the EVA (ethylene-vinyl acetate) which typically occur 3 month to 1 year after [4], [14]. However, those snail trails do not necessarily occur on all modules since it originates from a combination of different materials, UV radiation and temperature [4].
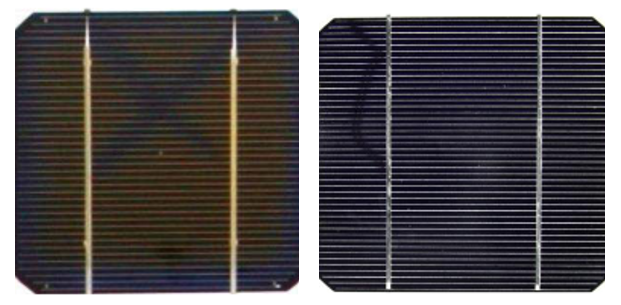
Delamination along the crack can also occur [6]. On another note, hot spots might happen when the cell is reversed biased and may accelerate delamination. [11].
V. Detection
Fortunately, several ways to detect those cracks are already in use.
- Visual inspection will often not detect those cracks if they have not developed snail trails or photobleaching.
- Electroluminescence (Figure 9, left) is the most common way to identify cracks. Combined with image recognition techniques, it can become a very efficient and accurate way of detecting crack spots.

- UV fluorescence as illustrated in Figure 9 (right) can also identify cell cracks.
- Photoluminescence is also a technique to locate cracks.
- If the cell is reverse-biased, the cell will appear hotter than the rest of the module. Infrared thermography can then detect it as shown in Figure 10, and with high resolution, the isolated parts can also be identified.

- Accurate IV-tracing could potentially detect changes in the resistance in series, current mismatches and recombination factors for cell cracks which has a significant impact on the module performance.
In conclusion, cell cracks in PV modules are an inevitable part of their aging process, however some cases might lead to significant losses at the module level until the activation of bypass diodes or the creation of hotspots.
References
[1] M. Köntges et al., ‘Review of Failures of Photovoltaic Modules’, IEA PVPS T13, Technical Report IEA-PVPS T13-01:2014, 2014.
[2] M. Köntges, S. Kajari-Schröder, and I. Kunze, ‘Crack Statistic for Wafer-Based Silicon Solar Cell Modules in the Field Measured by UV Fluorescence’, IEEE J. Photovolt., vol. 3, no. 1, pp. 95–101, 2013, doi: 10.1109/JPHOTOV.2012.2208941.
[3] A. Morlier, F. Haase, and M. Köntges, ‘Impact of Cracks in Multicrystalline Silicon Solar Cells on PV Module Power—A Simulation Study Based on Field Data’, IEEE J. Photovolt., vol. 5, no. 6, pp. 1735–1741, 2015, doi: 10.1109/JPHOTOV.2015.2471076.
[4] M. Herz, G. Friesen, U. Jahn, M. Köntges, S. Lindig, and D. Moser, ‘Quantification of Technical Risks in PV power Systems’, IEA PVPS, Technical Report IEA-PVPS T13-23:2021, Feb. 2022.
[5] M. Aghaei et al., ‘Review of degradation and failure phenomena in photovoltaic modules’, Renew. Sustain. Energy Rev., vol. 159, p. 112160, 2022, doi: 10.1016/j.rser.2022.112160.
[6] M. Köntges, G. Oreski, U. Jahn, M. Herz, P. Hacke, and K.-A. Weiss, ‘Assessment of photovoltaic module failures in the field’, IEA PVPS, IEA-PVPS T13-09:2017, 2017.
[7] M. Köntges, I. Kunze, S. Kajari-Schröder, X. Breitenmoser, and B. Bjorneklett, ‘Quantifying the risk of power loss in PV modules due to micro cracks’, Jan. 2010.
[8] E. Sarquis Filho, ‘Toward a Predictive Strategy for the Operation and Maintenance of PV Systems’, PhD Thesis, 2023.
[9] B. Braisaz, C. Duchayne, M. Van Iseghem, and R. Khalid, ‘PV aging model applied to several meteorological conditions’, Sep. 2014.
[10] D. C. Jordan, T. J. Silverman, J. H. Wohlgemuth, S. R. Kurtz, and K. T. VanSant, ‘Photovoltaic failure and degradation modes’, Prog. Photovolt. Res. Appl., vol. 25, no. 4, pp. 318–326, 2017, doi: 10.1002/pip.2866.
[11] M. Köntges, I. Kunze, S. Kajari-Schröder, X. Breitenmoser, and B. Bjørneklett, ‘The risk of power loss in crystalline silicon based photovoltaic modules due to micro-cracks’, Sol. Energy Mater. Sol. Cells, vol. 95, no. 4, pp. 1131–1137, 2011, doi: 10.1016/j.solmat.2010.10.034.
[12] M. Dhimish and Y. Hu, ‘Rapid testing on the effect of cracks on solar cells output power performance and thermal operation’, Sci. Rep., vol. 12, no. 1, p. 12168, Jul. 2022, doi: 10.1038/s41598-022-16546-z.
[13] J. I. Mölken et al., ‘Impact of Micro-Cracks on the Degradation of Solar Cell Performance Based On Two-Diode Model Parameters’, Energy Procedia, vol. 27, pp. 167–172, Dec. 2012, doi: 10.1016/j.egypro.2012.07.046.
[14] C. Miquel, C. Stravrou, N. Lebert, and J. Sarantou, ‘Dysfonctionnement électriques des installations photovoltaïques: points de vigilance.’, AQC - HESPUL, Technical Report PTVIGI1801, Oct. 2018.
[15] Daher, Daha Hassan et al., ‘Photovoltaic failure diagnosis using imaging techniques and electrical characterization’, EPJ Photovolt, vol. 15, p. 25, 2024, doi: 10.1051/epjpv/2024022.
[16] M. Dhimish and P. I. Lazaridis, ‘An empirical investigation on the correlation between solar cell cracks and hotspots’, Sci. Rep., vol. 11, no. 1, p. 23961, Dec. 2021, doi: 10.1038/s41598-021-03498-z.
